Note:
Detailed information can be found in 13.1 here. It’s helpful and is more robust on the maths.
What’s PCA all about?
High-dimensional data is a balls and often it could be condensed (think data that has columns Height and Shoe Size). Solution? Reduce the different dimensions to purely the dimensions that tell different and unique stories about the data. These new dimensions are the Principal Components.
ChatGPT Analogy
Imagine you have a large 3D file of a building and you want to reduce the size of it while keeping as much information as possible. You could take 5 still images of the building (1 each side and 1 of roof). You’ve condensed the file size but kept the crucial information from the unique principal components.
How do you do it?
High Level:
- Your first principal component is the one with the highest variance.
- Your next is one that orthogonal to that one.
- Keep going until you’ve all…
Example:
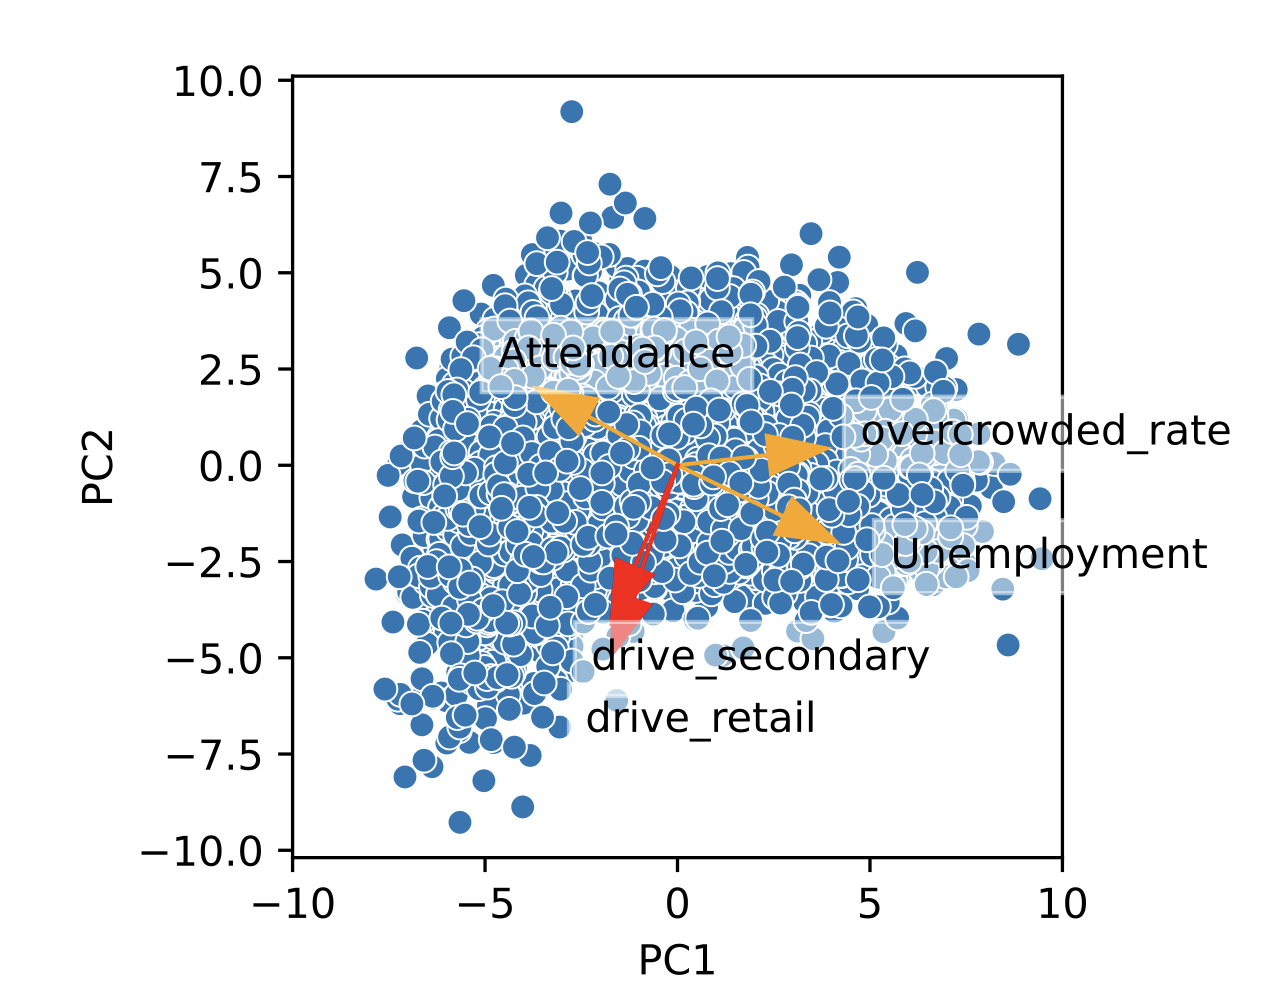
The above is a scatter plot for the 2 principal components, PC1 and PC2 of data referring to Scotland’s secondary schools, their students and the towns of which they’re in. You can see the vectors orthogonal to PC2 are all to do with Area Deprivation. Whereas to PC21 it's all about Distance from School`.
The Maths Behind the Graph 😱:
- The Principal Component Scores represent the new datapoints after they’ve been conformed to your new PCs. Mathematically: $$\begin{align}
t_{i1} &= p_{11}z_{i1} + p_{21}z_{i2} + \ldots + p_{D1}z_{iD} \
t_{i2} &= p_{12}z_{i1} + p_{22}z_{i2} + \ldots + p_{D2}z_{iD}
\end{align}